🐘 Vacuum your Elephants: improving PostgreSQL performance with autovacuum

Written by: Vlad Nikityuk and Valentin Lavrinenko.
Originally posted in the People.ai Engineering Blog
People.ai helps companies increase sales and marketing effectiveness by providing business data insights and helping with data input automation. At People.ai, we use various relational and NoSQL databases to process and store business data. In this article, we will focus on the PostgreSQL database, its internals, and some of the performance tweaks.
This story is about how we faced some critical performance issues with one of our database replicas and how we resolved all that burden with the correct Postgres autovacuum config.
The problem emerges
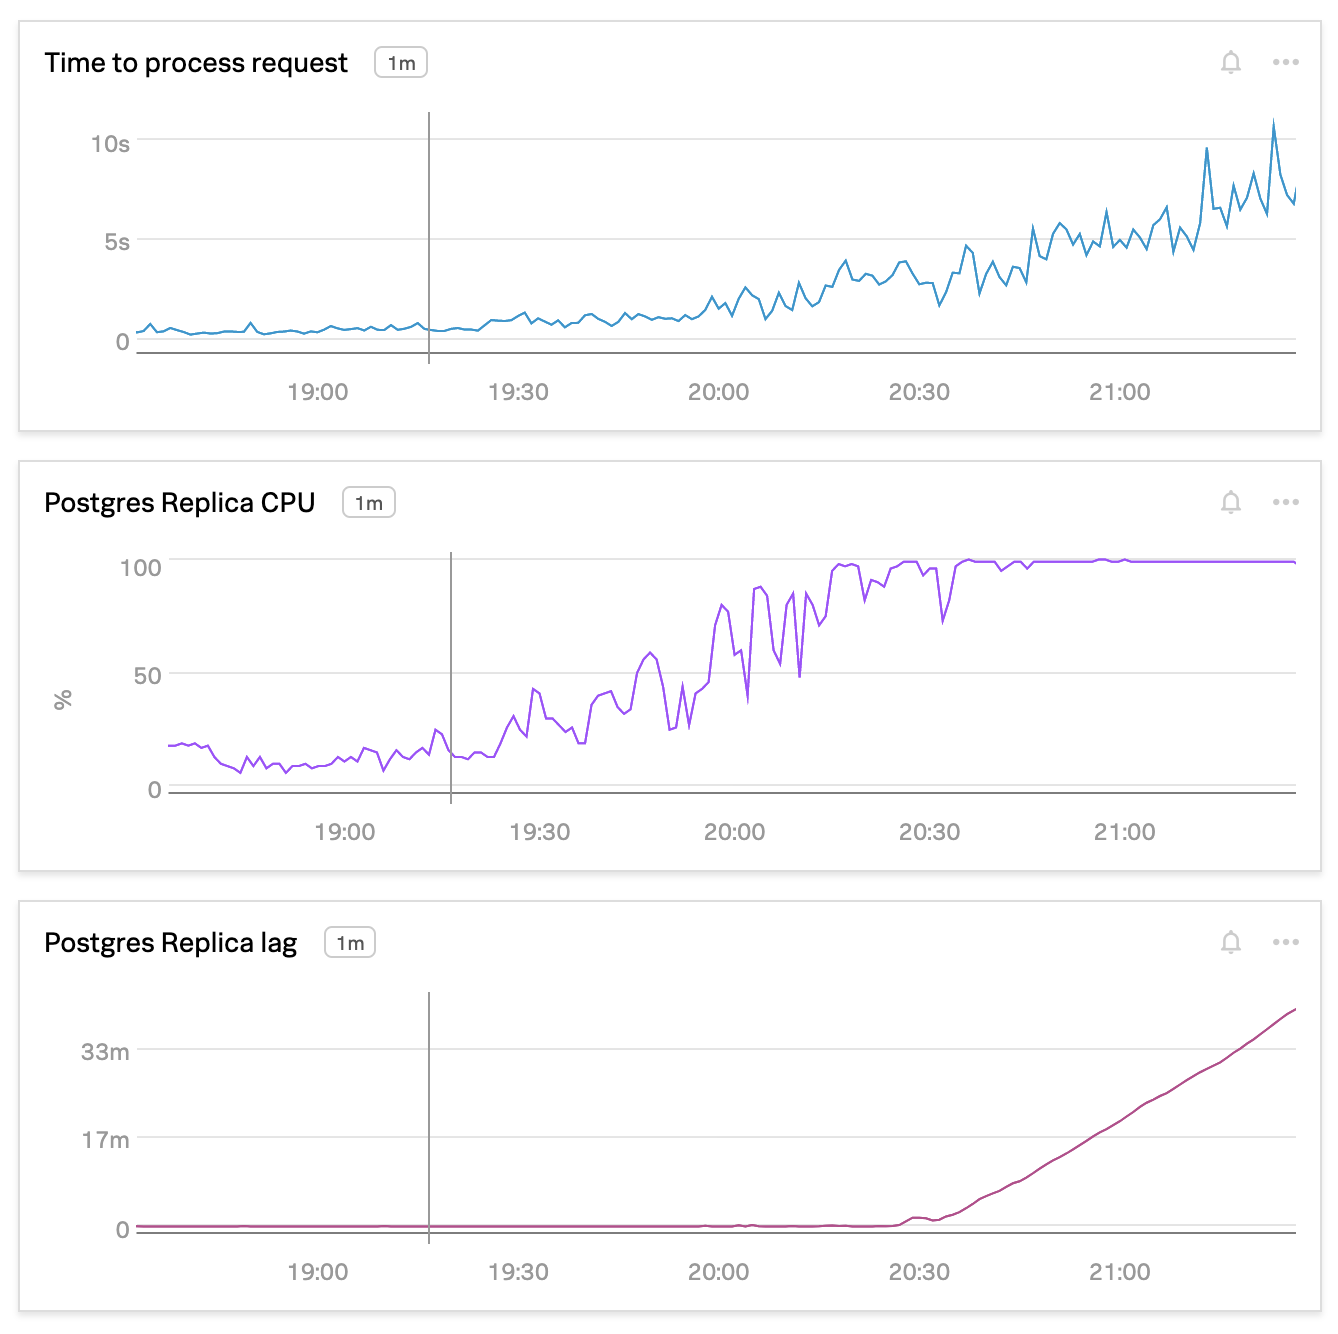
A few months ago, we noticed a rapidly increasing CPU load on one of our database replicas that is used in one of our processing pipelines. This happened during the onboarding of a big enterprise client. High CPU load on the database led to significant performance degradation of the data pipeline and finally slowed down the onboarding and also the real-time data processing.

Customer onboarding starts with the data ingestion process. Customer business data that we ingest usually consists of:
- CRM business objects (contacts, accounts, deals)
- Activity data (emails, calls, calendar events)
Once we’ve ingested CRM data we start processing activity data, which usually has a much higher volume and takes more time to complete. For one of the activity processing steps, a Postgres database is used as lookup storage for CRM data. We perform many different read queries against the database for each activity we process and there might be various reasons for high CPU load.
We started with Postgres’s slow query log and saw lots of queries that each took from 6 to 8 seconds. Further examination showed that all those queries were not using the index they were supposed to use, which led to much more expensive query execution costs. With even a slightly increased load, all those inefficient queries overloaded the database.
So what’s the reason for queries not using the right index?
The reason for that is table statistics. Postgres query planner uses statistics to make choices on query plans and estimate the number of rows that will be returned (you can read more about that postgresql.org/docs and citusdata.com/blog).
Autovacuum to the rescue
Statistics are updated by running the ANALYZE command. It can be executed manually, or by autovacuum process, separately or together with VACUUM. The VACUUM command also has to run regularly (see PostgreSQL documentation for details). In our case, the statistics were outdated because we have just ingested tons of CRM data into our database and it didn’t have enough time to run autovacuum.
The very first and naive solution that we did to fix the problem — we ran the ANALYZE command, this helped to resolve the issue right away, but there’s no guarantee that it will not happen again.

A few words on how autovacuum works. It is allowed to run simultaneously at most autovacuum_max_workers (3 by default) workers. Each worker picks a table that needs to be vacuumed and/or analyzed based on respective autovacuum_*_threshold and autovacuum_*_scale_factor settings: for example, VACUUM will be triggered after autovacuum_vacuum_threshold + autovacuum_vacuum_scale_factor * table_size tuples are updated or deleted in the table.
Autovacuum is also throttled according to autovacuum_vacuum_cost_limit and autovacuum_vacuum_cost_delay settings (read more here). The default values of those settings are reasonable in most cases, but your mileage may vary, and ours certainly did.
SELECT pid, state, age(clock_timestamp(), query_start), usename, query
FROM pg_stat_activity
WHERE state != 'idle'
AND query ILIKE '%vacuum%'
AND query NOT LIKE '%pg_stat_activity%'
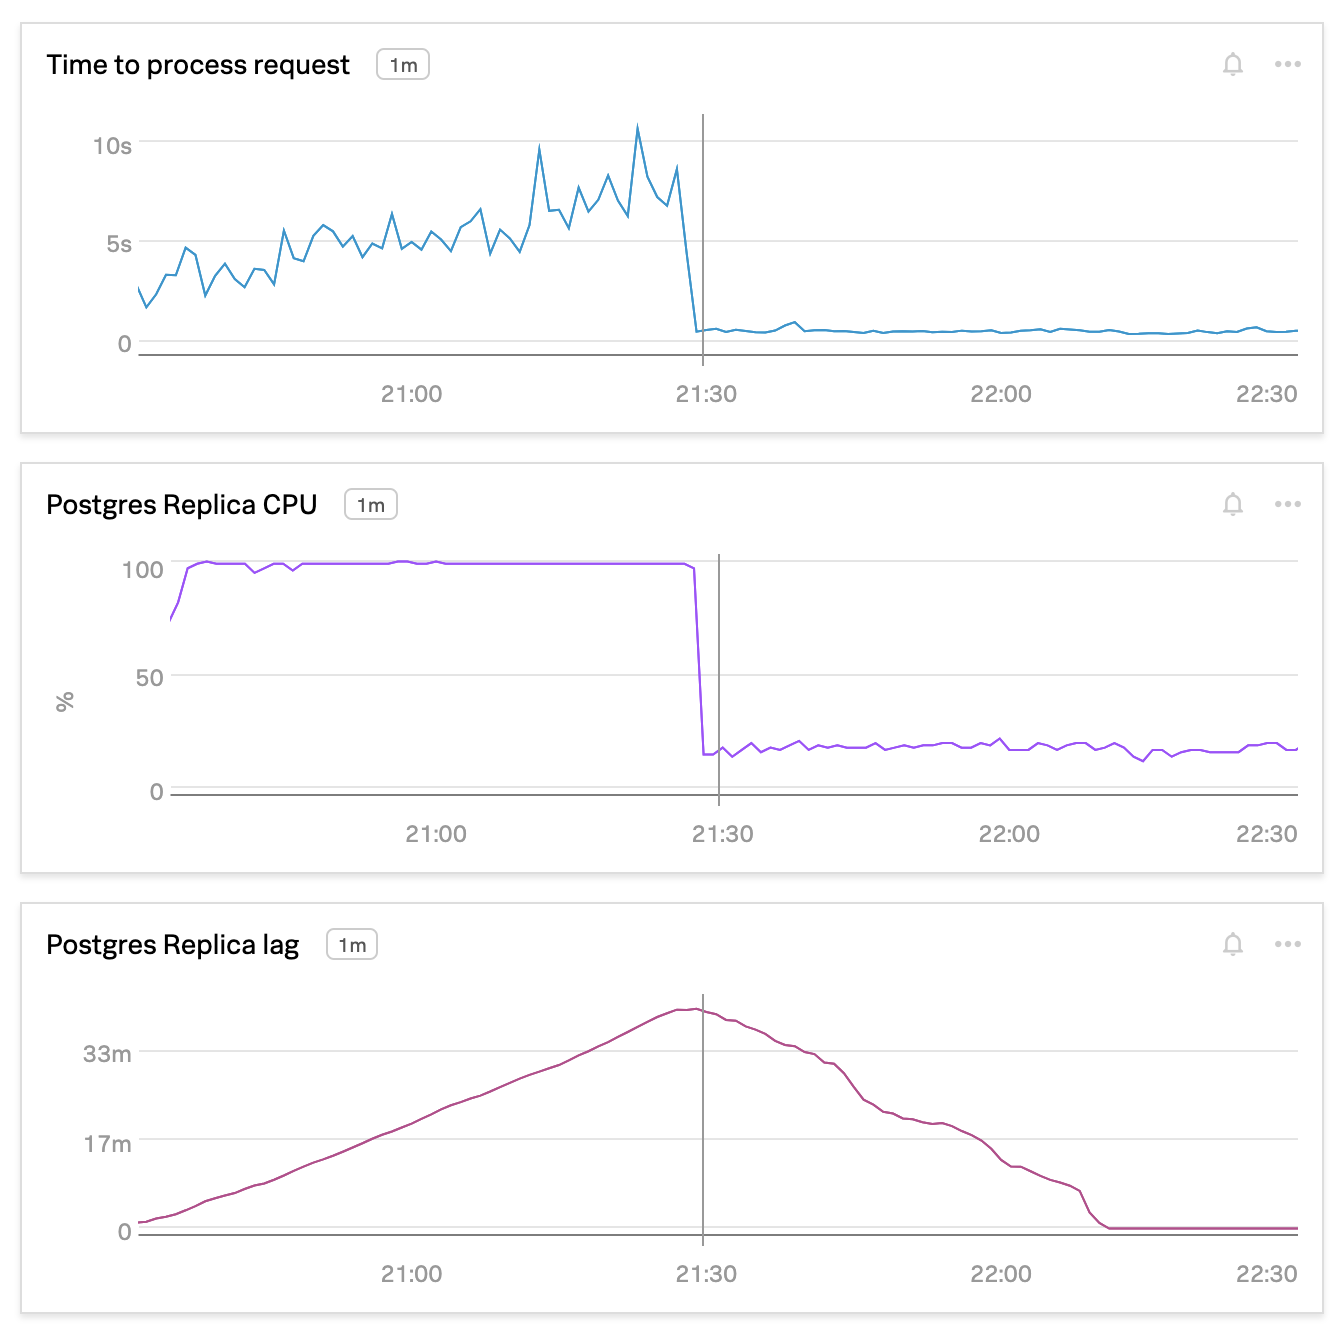
And we discovered that all the workers were constantly busy. Some of the tables didn’t get vacuumed for a long time, which caused not just outdated stats but also the proportion of dead tuples (deleted rows) to grow, impacting the overall database performance. The rate of modifications in many of our tables was just too big, so we’ve changed the autovacuum_vacuum_cost_limit from 200 to 1000, and the autovacuum_vacuum_cost_delay from 10 to 5. This allowed autovacuum to complete much faster (hours instead of weeks, minutes instead of days), and now we can see that most of the time there is no VACUUM running and tables are being vacuumed and analyzed in a timely manner.
Another important consideration is when to start the automatic VACUUM and ANALYZE. Many articles (see here and here for examples) recommend using more aggressive settings, to make autovacuum run more often, which makes it run faster. It didn’t work for us, though. What we’ve seen was that for large tables (hundreds of millions of rows), even when running on a freshly vacuumed table, the next VACUUM still took a relatively long time; increased VACUUM frequency resulted in an increase (instead of decrease) in total vacuum time for a given table. So, we’ve actually made autovacuum less aggressive, changing the autovacuum_vacuum_scale_factor from 0.1 to 0.2 and autovacuum_vacuum_threshold from 50 to 10,000. Autoanalyze, on the other hand, is very fast and doesn’t consume many resources. We already knew that our data modification patterns sometimes result in skewed statistics, so we’ve made the autoanalyze more aggressive, with autovacuum_analyze_scale_factor or 0.01 instead of 0.05.
Conclusion
Despite the fact that we had to learn a bit more about Postgres internals in order to make it work efficiently 🙃, we have achieved pretty good results — improved data pipeline reliability for onboarding and improved system overall performance by cleaning the storage from dead tuples.
There is a great quote from an article by Joel Spolsky — The Law of Leaky Abstractions
A famous example of this is that some SQL servers are dramatically faster if you specify “where a=b and b=c and a=c” than if you only specify “where a=b and b=c” even though the result set is the same. You’re not supposed to have to care about the procedure, only the specification. But sometimes the abstraction leaks and causes horrible performance and you have to break out the query plan analyzer and study what it did wrong, and figure out how to make your query run faster.
Joel reasons about abstractions, software complexity and comes to the conclusion that “All non-trivial abstractions, to some degree, are leaky.” That means that whatever abstraction you are using there will be a case when you will need to dive one level deeper to understand what is happening, like in our case with autovacuum.
Read more about our experience with PostgreSQL in these past articles: